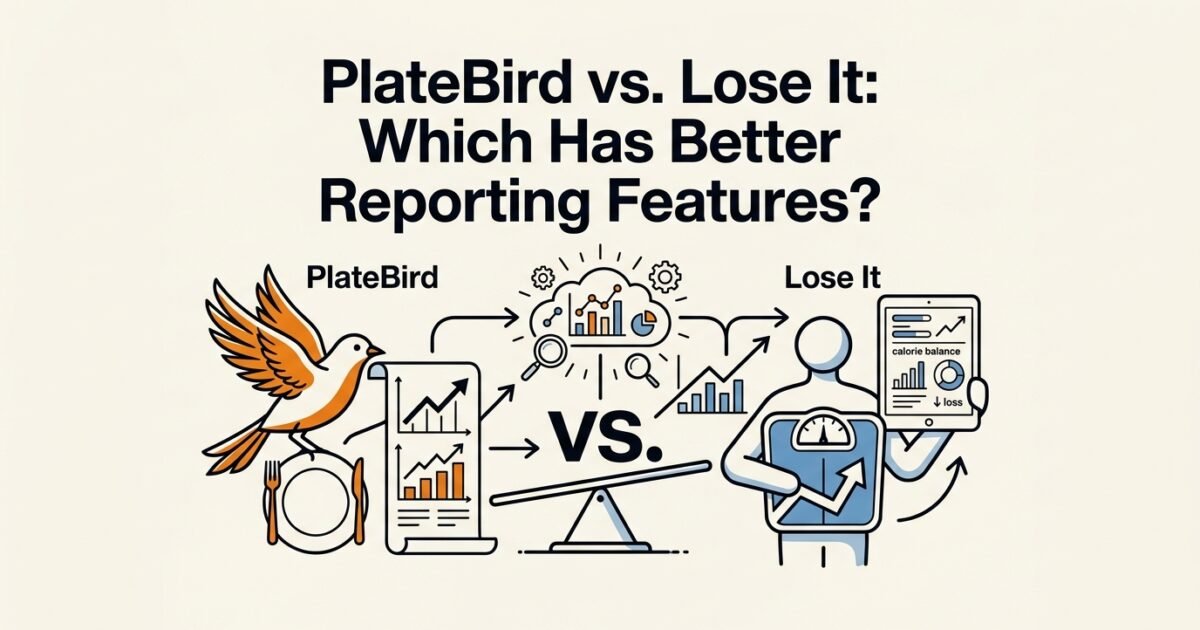
- What each app reports after you log a meal
- Nutrient breakdowns: calories, macros, and micronutrient depth
- Trend charts and goal tracking: spotting patterns over time
- Logging friction and its effect on reporting quality
- Feature checklist for busy professionals
- Which app wins for reporting in different scenarios
- Frequently asked questions
PlateBird vs. Lose It: Which Has Better Reporting Features?
You open a calorie tracker after dinner, scroll past a wall of numbers, and still have no idea whether today was actually a good day or a bad one. The calories are there. The macros are there. But nothing tells you what changed, what drifted, or what to do differently tomorrow.
That friction is a reporting problem, not a logging problem. Both PlateBird and Lose It capture your food data. Where they split is in what they do with it afterward. The PlateBird vs. LoseIt comparison on reporting features comes down to one question: which app turns your food log into something you can actually act on?
This article breaks that down section by section. No hype. No winner declared before the evidence. Just a clear look at what each app shows you, how readable it is, and which setup fits which kind of user.
What each app reports after you log a meal
After you enter food, both apps show you a running calorie total and a macro split. That part is standard. The difference shows up in how quickly you can read it and what the summary actually tells you.
PlateBird’s post-log summary
PlateBird uses text or photo input. You type what you ate or snap a picture, and the app calculates calories, protein, carbs, and fat automatically. No barcode scanning, no database searching. The result lands in your log in seconds. Related reading: PlateBird vs Carb Manager: Best for Low-Carb Tr….
The summary view is minimal by design. You see your daily totals, a macro breakdown, and your remaining targets. It is fast to read. You can check it between meetings and know in under 30 seconds whether you are on track.
Lose It’s post-log summary
Lose It builds its reporting around a more structured entry workflow. You search a food database, scan a barcode, or log from a saved meal. The payoff is a detailed entry that ties back to a specific food item with a known nutritional profile.
The daily summary in Lose It shows calories in versus calories out, a macro ring chart, and a meal-by-meal breakdown. Lose It’s free tier covers basic calorie and macro tracking, while the Premium plan adds deeper nutrient visibility and trend reports. That Premium layer is where the reporting comparison gets more interesting.
Quick comparison: core reporting outputs
| Feature | PlateBird | Lose It (Free) | Lose It (Premium) |
|---|---|---|---|
| Daily calorie summary | Yes | Yes | Yes |
| Macro breakdown (protein, carbs, fat) | Yes | Yes | Yes |
| Meal-level breakdown | Yes | Yes | Yes |
| Micronutrient detail | No | Limited | Yes |
| Weekly trend charts | Basic | Limited | Yes |
| Historical pattern view | Basic | No | Yes |
| Entry method | Text or photo (AI) | Database, barcode | Database, barcode, AI scan |
The best tracker is not the one with the most features. It is the one you actually keep logging in, consistently, on busy days and slow ones alike.

Nutrient breakdowns: calories, macros, and micronutrient depth
Calorie and macro tracking covers most use cases. But if your goal involves sodium management, fiber targets, or cholesterol monitoring, the depth of nutrient reporting starts to matter a lot more.
What PlateBird shows at the nutrient level
PlateBird reports the four core macros: calories, protein, carbohydrates, and fat. That covers the needs of someone managing a 2,000 calorie daily target, hitting a 40g daily fiber goal, or trying to keep protein above 150g per day. The display is clean and quick to read.
Micronutrient detail is not a current focus. If you need to track sodium below 1,500mg per day, monitor potassium, or check cholesterol, PlateBird does not surface that data. That is a real limitation for users with clinical nutrition goals.
What Lose It Premium adds
Lose It Premium expands nutrient reporting considerably. The Premium plan adds deeper macronutrient and micronutrient visibility, including sodium, fiber, sugar, cholesterol, and vitamins. For a user tracking sodium to stay under 2,000mg per day, that is genuinely useful data that the free tier and PlateBird do not provide.
The trade-off is cost. Lose It Premium runs around $40 per year. That is reasonable if you use the nutrient depth. It is wasted if you only check calories and protein.
When nutrient depth actually matters
A useful heuristic: micronutrient reporting matters when you have a specific medical or performance reason to track it. For general weight management or macro-based fitness goals, protein, carbs, fat, and calories cover 90% of what you need to act on. Deeper reporting is useful only when you can read it and respond to it.
If your dashboard only shows calories, you are missing the why behind the number. But a dashboard that shows 40 nutrients is only useful if you know which 3 to watch.
Trend charts and goal tracking: spotting patterns over time
A single day’s log is a data point. A week of logs is a pattern. A month is a habit. The apps differ significantly in how well they surface those longer views.
Lose It’s trend reporting
Lose It Premium includes weekly and monthly trend charts. You can see your calorie average over the past 7 days, track macro consistency, and review progress against a goal weight. Lose It sits among the more established apps for structured progress tracking, and the Premium dashboard is the main reason for that reputation.
The charts are readable on mobile. A 7 day calorie view takes about 10 seconds to interpret. That is the standard a busy user needs. Anything that requires more than a minute of scrolling to understand is invisible.
PlateBird’s trend visibility
PlateBird’s trend reporting is more basic at this stage. You can review your daily logs and see running totals, but the app is not built around a deep analytics dashboard. The value proposition is speed of entry, not depth of historical analysis.
For a user who wants to spot a 3 week protein drift or compare two months of eating patterns, Lose It Premium has a clear advantage here. That is not a knock on PlateBird’s core purpose. It is just an honest read of where each app focuses its energy.
What a useful trend chart actually answers
A good report answers one question fast: what changed this week? If the trend view makes you dig through 4 screens to find that answer, it is not helping you change behavior. Both apps have room to improve on this, but Lose It’s Premium tier is closer to a functional weekly review tool right now.

Logging friction and its effect on reporting quality
Reporting quality depends on one thing before it depends on anything else: whether you actually log reliably. A beautiful dashboard fed by 3 days of data out of 7 tells you almost nothing useful.
How PlateBird reduces the logging barrier
PlateBird’s text and photo entry removes the two biggest friction points in food logging: searching a database and scanning barcodes. You type “grilled salmon with roasted broccoli” or snap a plate photo, and the app handles the calculation. That takes under 15 seconds per meal.
Lower friction usually means more consistent logging. More consistent logging means the trend data is representative of your real eating patterns. In that sense, PlateBird’s entry method is a reporting feature, even if it does not look like one. If you want to see how this plays out in a real workflow, the lazy person’s macro tracking setup on the PlateBird site shows a practical version of this approach.
How Lose It’s structured entry works
Lose It’s barcode scanner and food database work well when you are eating packaged foods with clear labels. A 32g serving of oats from a known brand logs accurately and fast. Hands-on walkthroughs of Lose It’s logging workflow show how the barcode approach suits users who prefer explicit, database-matched entries.
The friction increases with restaurant meals, home-cooked dishes, or mixed plates. Searching for “homemade chicken stir fry” in a database produces variable results. That variability affects the accuracy of the data feeding the reports. If your logging drops off on weekends or travel days, the trend charts lose their reliability fast.
Better reporting starts with better logging habits. The app that makes logging feel effortless on a Tuesday night after a long day is the one that produces the most honest data trail.
Feature checklist for busy professionals
Business owners and professionals who track nutrition usually need one thing above all: a fast read on whether today was on track. They do not have 10 minutes to dig through a dashboard. They need insight density, not feature volume.
Speed of review
PlateBird wins on speed. The daily summary is readable in under 30 seconds. Lose It’s free tier is comparable. Lose It Premium adds more data, which takes slightly longer to scan but gives more context when you have the time.
Clarity of the macro picture
Both apps show a macro ring or bar chart at the daily level. PlateBird’s layout is simpler. Lose It Premium’s layout carries more information. A useful heuristic: if you are tracking 3 or 4 metrics, PlateBird’s display is easier to read at a glance. If you are tracking 8 or more nutrients, Lose It Premium’s dashboard earns its complexity.
Practical scorecard
- Speed of entry: PlateBird logs a meal in under 15 seconds via text or photo. Lose It’s database search takes 30 to 90 seconds for mixed dishes.
- Macro clarity: Both apps show protein, carbs, and fat clearly. PlateBird’s layout is simpler; Lose It Premium’s is more detailed.
- Trend depth: Lose It Premium shows 7 day and 30 day calorie and macro trends. PlateBird’s historical view is more limited.
- Micronutrient access: Lose It Premium tracks sodium, fiber, sugar, cholesterol, and vitamins. PlateBird tracks the 4 core macros only.
- Logging consistency: PlateBird’s low-friction entry tends to support more consistent daily logging. Consistent logs produce more reliable reports.
- Cost: PlateBird is free to download. Lose It’s meaningful reporting features sit behind a Premium subscription at around $40 per year.
For a user who needs a fast check-in between meetings, PlateBird’s simplicity is an asset. For a user who wants a structured weekly review with nutrient-level detail, Lose It Premium is the more complete tool. The make-ahead macro lunches guide on PlateBird’s site shows how fast logging fits into a structured workday routine. We cover this topic in more depth in Intermittent Fasting and Macro Tracking: A Plat….

Which app wins for reporting in different scenarios
There is no universal answer here. The better reporting app depends on what you are trying to do with the data.
Choose PlateBird if
- You eat a lot of restaurant meals, mixed dishes, or home-cooked food that does not have a barcode. Photo and text entry handles these without guesswork.
- Your main goal is staying within a daily calorie range and hitting a protein target, such as 150g per day. The 4 macro summary covers that completely.
- You have tried other trackers and quit because logging felt like a second job. Lower friction means more consistent data, which means more useful reports over time.
- You want a free option that gives you a clear daily picture without a subscription.
Choose Lose It Premium if
- You need micronutrient tracking, such as keeping sodium under 1,500mg per day or monitoring fiber intake above 30g daily.
- You want 30 day trend charts and structured goal-progress views as a core part of your weekly review.
- You eat a lot of packaged foods with clear labels. Barcode scanning is fast and accurate in that context.
- You are willing to pay around $40 per year for deeper reporting and have specific nutrition goals that require it.
The honest verdict
Lose It Premium has more reporting features. That is simply true. But more features only matter if you use them. User reviews of Lose It steadily note the Premium dashboard as a strength, alongside occasional friction with the logging workflow for non-packaged foods.
PlateBird’s reporting is narrower, but the path from meal to logged entry is shorter. For a busy professional who logs 5 to 6 days per week regularly, a simpler dashboard fed by complete data often tells a more accurate story than a rich dashboard fed by 3 days of entries.
Choose the tracker that matches how you actually eat and how much time you will realistically spend reviewing data, not the one with the most impressive feature list on paper.
Frequently asked questions
Does AI logging reduce reporting accuracy?
It depends on the meal. For home-cooked dishes and restaurant plates, AI-based photo and text entry can be as accurate as a manual database search, sometimes more so, because it avoids the wrong-entry errors that come from picking a close-but-not-exact database match. For packaged foods with known nutritional labels, barcode scanning gives a precise figure tied to a specific product. Neither method is perfect. Both introduce some margin of error, typically within 10% to 15% for mixed dishes.
Does richer reporting always beat simpler reporting?
No. A dashboard that surfaces 40 nutrients is useful only if you know which 3 to act on. For most people managing general health or weight, protein, carbohydrates, fat, and total calories cover the decisions that matter. Richer reporting earns its complexity when you have a specific clinical or performance reason to track additional nutrients, such as managing blood pressure with a sodium cap of 1,500mg per day.
Should I prioritize nutrient depth or consistency of use?
Consistency usually matters more. A 7 day log that captures every meal at a macro level tells you more than a 3 day log with full micronutrient detail. The app that makes logging feel easy on a Friday night after a long week is the one that produces the most honest picture of your eating patterns. Start with the app you will actually use daily, then add nutrient depth if your goals require it.
Can I connect Lose It to other apps and devices?
Lose It supports connections to third-party apps and wearables, including fitness trackers that feed calorie-burn data into the reporting dashboard. That integration can make the calorie-balance picture more complete for users who exercise regularly and want their output tracked alongside their intake.
Is Lose It Premium worth the cost for reporting alone?
If you need micronutrient tracking, 30 day trend charts, or structured goal-progress reports, the $40 per year cost is reasonable. Lose It Premium’s deeper nutrient and trend features are the main differentiator from the free tier. If your goals only require calorie and macro awareness, the free tier or a simpler app may cover your needs without the subscription. Feature comparison videos for Lose It and hands-on Premium walkthroughs can help you judge whether the extra depth matches your actual tracking habits before committing.
Your food log is only as useful as the reports you actually read and act on. Whether you need PlateBird’s streamlined macro view or Lose It Premium’s detailed nutrient breakdown depends on your specific goals and how much time you have for weekly reviews. Try PlateBird free to see how fast logging affects the quality of your tracking data over time. You might also find our guide on How PlateBird Helps Home Workout Enthusiasts Tr… helpful.